Key Performance Indicators (KPIs) in Construction
Establishing metrics to monitor progress and success.
Updated April 2026 — a complete guide to construction KPIs, written for UK quantity surveyors, commercial managers and students. Learn the seven KPI categories, how to calculate them, the latest industry benchmarks, worked examples and how KPIs link to NEC and JCT contracts.
Why KPIs Matter in Construction
Key performance indicators (KPIs) are the quantifiable metrics that tell us whether a construction project, a company or the wider industry is succeeding. They translate broad objectives — “deliver on time and budget,” “build safely,” “reduce carbon” — into hard numbers that teams can track, benchmark and act on.
For the quantity surveyor, KPIs are not just a management fad. They sit at the heart of commercial control: cost predictability, profitability and client satisfaction with value are all QS-owned metrics that feed directly into tender submissions, board reports and supply-chain performance reviews.
A Brief History: From the Egan Report to Today
The modern KPI framework in UK construction traces back to Sir John Egan’s 1998 report, Rethinking Construction. Egan set headline targets for the industry — annual reductions of 10% in cost, 10% in time and 20% in defects — and these targets spawned the Construction Industry KPI programme in 1999.
Today the baton is carried by Constructing Excellence and Glenigan’s KPI Zone, which publish annual benchmarks in partnership with industry. The Construction Leadership Council has set newer, stretching goals: a 33% reduction in project cost, 50% in time and 50% in carbon emissions.
The Seven Categories of Construction KPIs
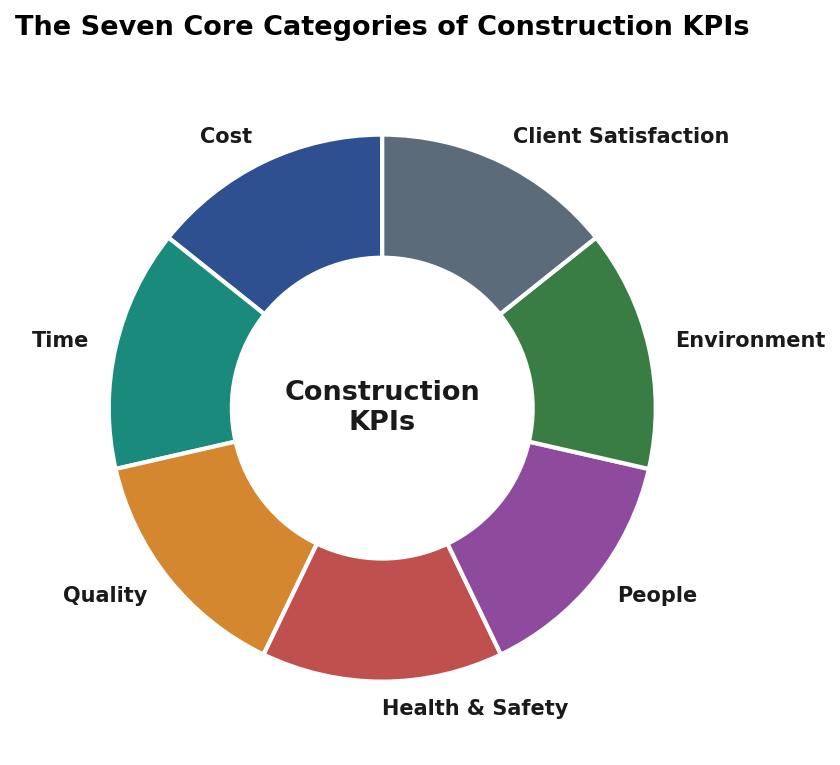
Most frameworks group KPIs into seven categories. Each category maps to a different aspect of project and organisational health.
| Category | Example KPIs | Why QSs Care |
|---|---|---|
| Cost (Economic) | Cost predictability, profitability, productivity (£/FTE) | Core commercial metrics owned by the QS |
| Time | Time predictability, defect rectification speed | Delay drives cost; QS quantifies impact |
| Quality | Defects at handover, defects score (1–10) | Defects cost money and erode margin |
| Health & Safety | AFR, RIDDOR, LTIFR, near-misses | Incidents disrupt programme and prelims |
| People | Turnover, training days, diversity | Staff retention links to productivity |
| Environment | tCO₂e (Scopes 1–3), waste to landfill, water | Increasingly tied to payment and tender scoring |
| Client Satisfaction | Product, service, value (1–10 scales) | Repeat business depends on it |
How to Calculate the Big Four KPIs
The four KPIs most relevant to quantity surveyors are cost predictability, time predictability, defects score and the Accident Frequency Rate. Each has a straightforward formula.
1. Cost Predictability (%)
Cost Predictability = ((Actual Cost − Forecast Cost) ÷ Forecast Cost) × 100
Positive values indicate overrun, negative values indicate underrun. Client-requested changes are normally excluded so that the number reflects contractor performance, not scope creep. The conventional target is within ±5%.
2. Time Predictability (%)
Time Predictability = ((Actual Duration − Forecast Duration) ÷ Forecast Duration) × 100
Measured at practical completion against the programme agreed at Commit to Construct. Again the target is typically ±5%.
3. Defects Score (1–10)
A qualitative assessment at handover, where 9–10 = excellent, 7–8 = good, 5–6 = acceptable and below 5 = poor. Some organisations also count the number of punch-list items per 1,000 m² (a benchmark of fewer than 20 is considered strong).
4. Accident Frequency Rate (AFR)
AFR = (RIDDOR incidents ÷ Total hours worked) × 100,000
Expressed as reportable incidents per 100,000 hours worked. According to HSE data, construction’s fatal injury rate in 2024/25 was 1.92 per 100,000 workers — roughly 4.8 times the all-industry average. Leading major projects such as HS2 have achieved AFRs as low as 0.05.
Worked Example: A £5 Million Office Refurbishment
Let’s tie the numbers together with a realistic mini case study.
Project brief: £5 million commercial office refurbishment over a 52-week programme. At practical completion, the final account settles at £5,085,000 (excluding £120,000 of client-requested changes) and the project takes 56 weeks.
| KPI | Calculation | Result | Status |
|---|---|---|---|
| Cost Predictability | (5,085,000 − 5,000,000) / 5,000,000 × 100 | +1.7% | Green |
| Time Predictability | (56 − 52) / 52 × 100 | +7.7% | Amber |
| Defects Score | Assessment at PC | 8.2 / 10 | Green |
| AFR | 2 RIDDOR / 250,000 hrs × 100,000 | 0.80 | Green |
The project delivered within acceptable cost tolerance and with strong safety and quality performance, but lost four weeks on programme. That is the kind of nuance a KPI dashboard makes visible at a glance.
Building a KPI Dashboard
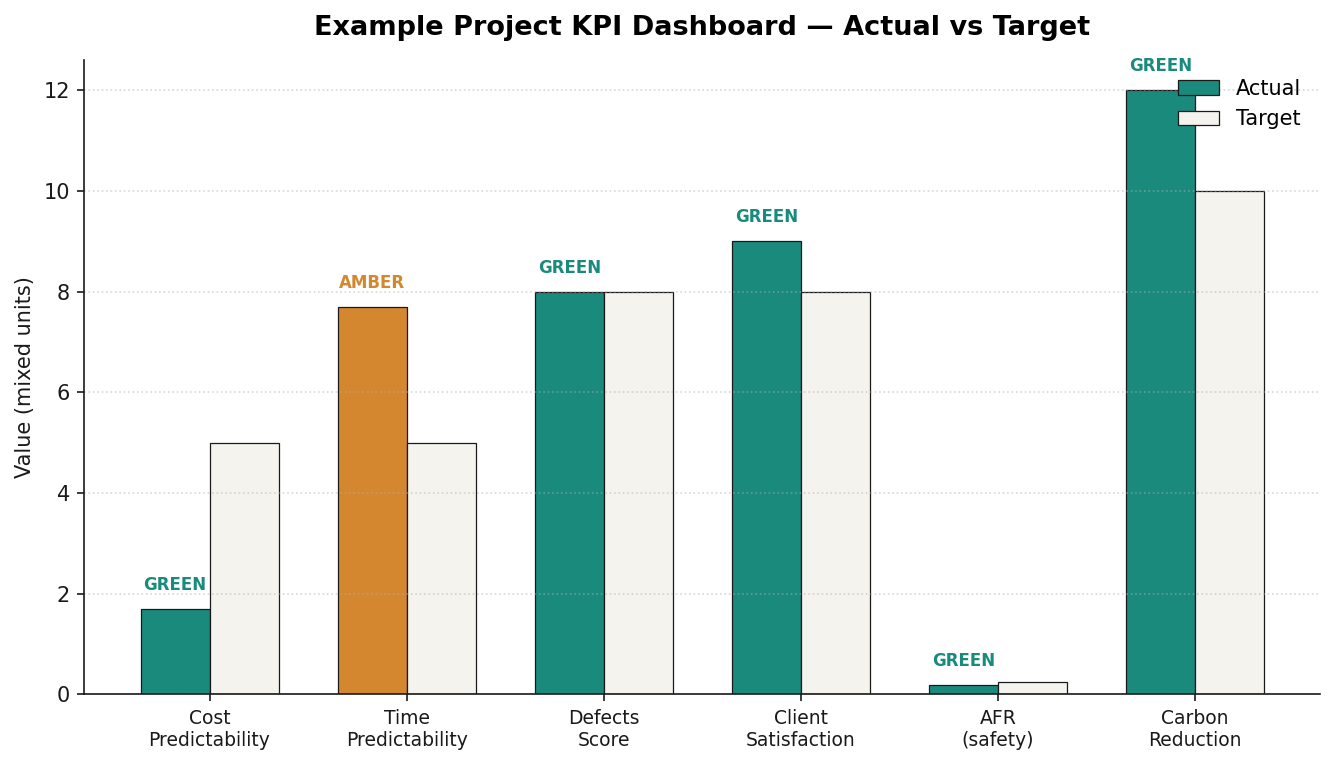
A good KPI dashboard shows six to eight indicators — no more — paired with clear targets and a traffic-light status. Limit yourself to the metrics that drive decisions and fit on a single page. The example above pairs cost and time predictability with quality, safety, client satisfaction and a carbon reduction target.
Project vs Company vs Industry KPIs
KPIs operate at three levels and it is important not to confuse them:
Project level — granular, day-to-day, used by site and commercial teams to drive decisions. Monthly or weekly reporting.
Company level — aggregated across a portfolio. Used for board reporting, tender submissions and bonus calculations. Annual or bi-annual.
Industry level — national benchmarks published by Glenigan and Constructing Excellence, used by policymakers and clients to set targets such as those in the CLC Delivery Plan. Annual.
Linking KPIs to Contracts: NEC4 Option X20 and JCT Frameworks
KPIs are not just a management report — they can be hard-wired into contracts.
NEC4 Option X20 (Key Performance Indicators)
Under NEC4, Option X20 lets the client set KPIs with associated incentive payments. The Incentive Schedule lists each indicator, target and payment. Option X20 provides for positive payments only — if the client wants penalties, a Z clause is required. Note that Option X20 cannot be used alongside Option X12 (Multiparty Collaboration). The NEC Project Manager reports performance at defined intervals, typically monthly.
Example: a client offers a £50,000 bonus if the final account lands within ±2% of forecast, plus a further £25,000 if the project completes within ±3% of programme. The contractor measures and reports; the QS on both sides certifies.
JCT Framework Agreements
JCT standard contracts, particularly framework agreements, increasingly embed KPI targets as contract particulars. Bonuses or efficiency discounts can be tied to sustained performance across a call-off pipeline. The JCT framework suite is widely used for long-term, repeat-build client relationships.
Common KPI Pitfalls
Tracking too many KPIs. If everything is a priority, nothing is. Pick six to eight strategic indicators and review them ruthlessly.
Lagging without leading. Defects at handover (lagging) tells you the answer too late. Pair it with leading indicators such as daily quality inspections completed or first-time-right rates.
Gaming the metrics. Unrealistic targets encourage creative reporting. Link rewards to process compliance as well as outcomes.
Collecting data without acting on it. A dashboard that nobody reviews is just expensive wallpaper. Assign ownership, schedule reviews and agree corrective actions.
Contextual blindness. Do not benchmark a Grade-II listed refurbishment against a volume housebuilder’s standard plot. Compare like with like.
Common Questions About Construction KPIs (FAQ)
What are KPIs in construction?
KPIs (key performance indicators) are quantifiable metrics used to measure how well a construction project, company or the wider industry is performing against agreed targets. They typically cover cost, time, quality, safety, people, environment and client satisfaction.
What is the most important KPI for a quantity surveyor?
Cost predictability is usually the headline KPI for QSs because it directly reflects commercial control. Profitability and client satisfaction with value are close seconds — all three are measures the QS can influence and evidence.
How do you calculate cost predictability?
Cost predictability = ((actual cost − forecast cost) ÷ forecast cost) × 100. Client-requested changes are typically excluded so the result reflects contractor performance rather than scope change.
What is a good AFR in construction?
A lower AFR is better. The UK construction industry average hovers around 2.6 per 100,000 hours, but leading projects such as HS2 have achieved AFRs as low as 0.05. Most major contractors target an AFR under 1.0.
What is NEC4 Option X20?
Option X20 is the NEC4 secondary option that allows clients to set KPIs with associated incentive payments. The contractor is paid bonuses for meeting or exceeding targets set out in an Incentive Schedule. It provides for positive payments only and cannot be combined with Option X12.
Where can I find current UK construction KPI benchmarks?
The most authoritative source is Glenigan’s KPI Zone, published in partnership with Constructing Excellence. HSE publishes current safety statistics freely, and the Construction Leadership Council sets strategic targets for the industry.
How many KPIs should a project track?
Six to eight strategic indicators is the sweet spot. Fewer than that risks missing material issues; more than that dilutes focus and creates reporting fatigue.
Key Takeaways
- KPIs translate strategic goals into measurable action across cost, time, quality, safety, people, environment and client satisfaction.
- The big four for QSs are cost predictability, time predictability, defects score and AFR.
- Benchmark against Glenigan’s KPI Zone and CLC targets; don’t compare apples to oranges.
- Modern contracts like NEC4 Option X20 and JCT framework agreements embed KPIs as payment drivers.
- Keep dashboards to six to eight indicators, pair lagging with leading metrics, and — above all — act on the data.
Further Reading on ProQS.site
- Post-Contract Cost Management: A QS Guide
- NRM 1 and Cost Planning Explained
- Earned Value Management for Quantity Surveyors
- Change Management in Construction Contracts