How to Read Architectural Drawings
Architectural drawings are the primary language of construction. Every building starts as a set of drawings, and the quantity surveyor’s ability to read, interpret, and measure from those drawings underpins the entire cost management process. Whether you are preparing a bill of quantities, checking a contractor’s interim valuation, or advising on a variation, accurate drawing interpretation is non-negotiable.
This guide covers the full range of architectural drawings you will encounter in UK practice, from floor plans through to detail drawings. It explains the conventions, symbols, and standards that govern how information is presented, and — critically — what the QS needs to extract from each drawing type to do their job properly.
Types of Architectural Drawing
A typical UK construction project will produce dozens, sometimes hundreds, of drawings across multiple disciplines. The architectural set forms the backbone of the design information, and the QS must understand what each drawing type shows and what can be measured from it.
Floor plans are the most commonly referenced drawings in QS practice. A floor plan is a horizontal section through the building, typically cut at approximately one metre above floor level and viewed from above. It shows room layouts, internal dimensions, wall positions, door and window locations, and structural grid lines. The QS extracts room areas (for finishes measurement), wall lengths (for partitions and internal walls), and door and window counts (cross-referenced against schedules). Standard scale is 1:100 for most projects, dropping to 1:50 for smaller or more detailed layouts.
Elevations show the external faces of the building as orthographic projections — flat, two-dimensional views of each façade. Internal elevations may also be provided for kitchens, bathrooms, or feature walls. The QS uses elevations to calculate façade areas (total area minus openings), identify cladding materials and finishes, verify window and door positions, and measure parapets, canopies, and balcony projections. Typical scales are 1:100 or 1:200.
Sections are vertical cuts through the building, showing the relationship between floors, ceilings, walls, and roof. Elements cut by the section plane appear as bold lines; elements visible beyond the cut appear as thinner lines. Sections are essential for the QS because they reveal floor-to-floor heights, structural slab depths, ceiling heights, roof pitch and construction, and the vertical build-up of walls and floors. Scale is typically 1:50 or 1:100.
Detail drawings show small portions of the building at larger scale (1:10, 1:5, or even 1:1), illustrating how component parts fit together. Junction details, window frames, roof-to-wall connections, and bespoke joinery are all shown at this level. The QS uses detail drawings to confirm material specifications, identify complex construction methods, and price specialist or non-standard items.
Site plans show the entire development in context — building footprint, boundaries, access roads, drainage, landscaping, and external services. The QS measures external works quantities from site plans: hard and soft landscaping areas, drainage runs, fencing lengths, and car parking. Scales range from 1:200 for small sites to 1:500 or 1:2500 for larger developments.
Reflected ceiling plans (RCPs) show the ceiling layout as if reflected in the floor below. They indicate ceiling types and heights, lighting positions, ventilation grilles, sprinkler heads, and acoustic treatments. The QS extracts ceiling areas by type and quantities of ceiling-mounted services items. Scale is typically 1:100.
Roof plans show the building from above, indicating roof covering materials, fall directions, gutters, downpipes, roof plant, safety access provisions, and any roof-mounted equipment. The QS measures roof covering areas (accounting for pitch), gutter and downpipe lengths, and roof safety provisions.
The Floor Plan — A Worked Example
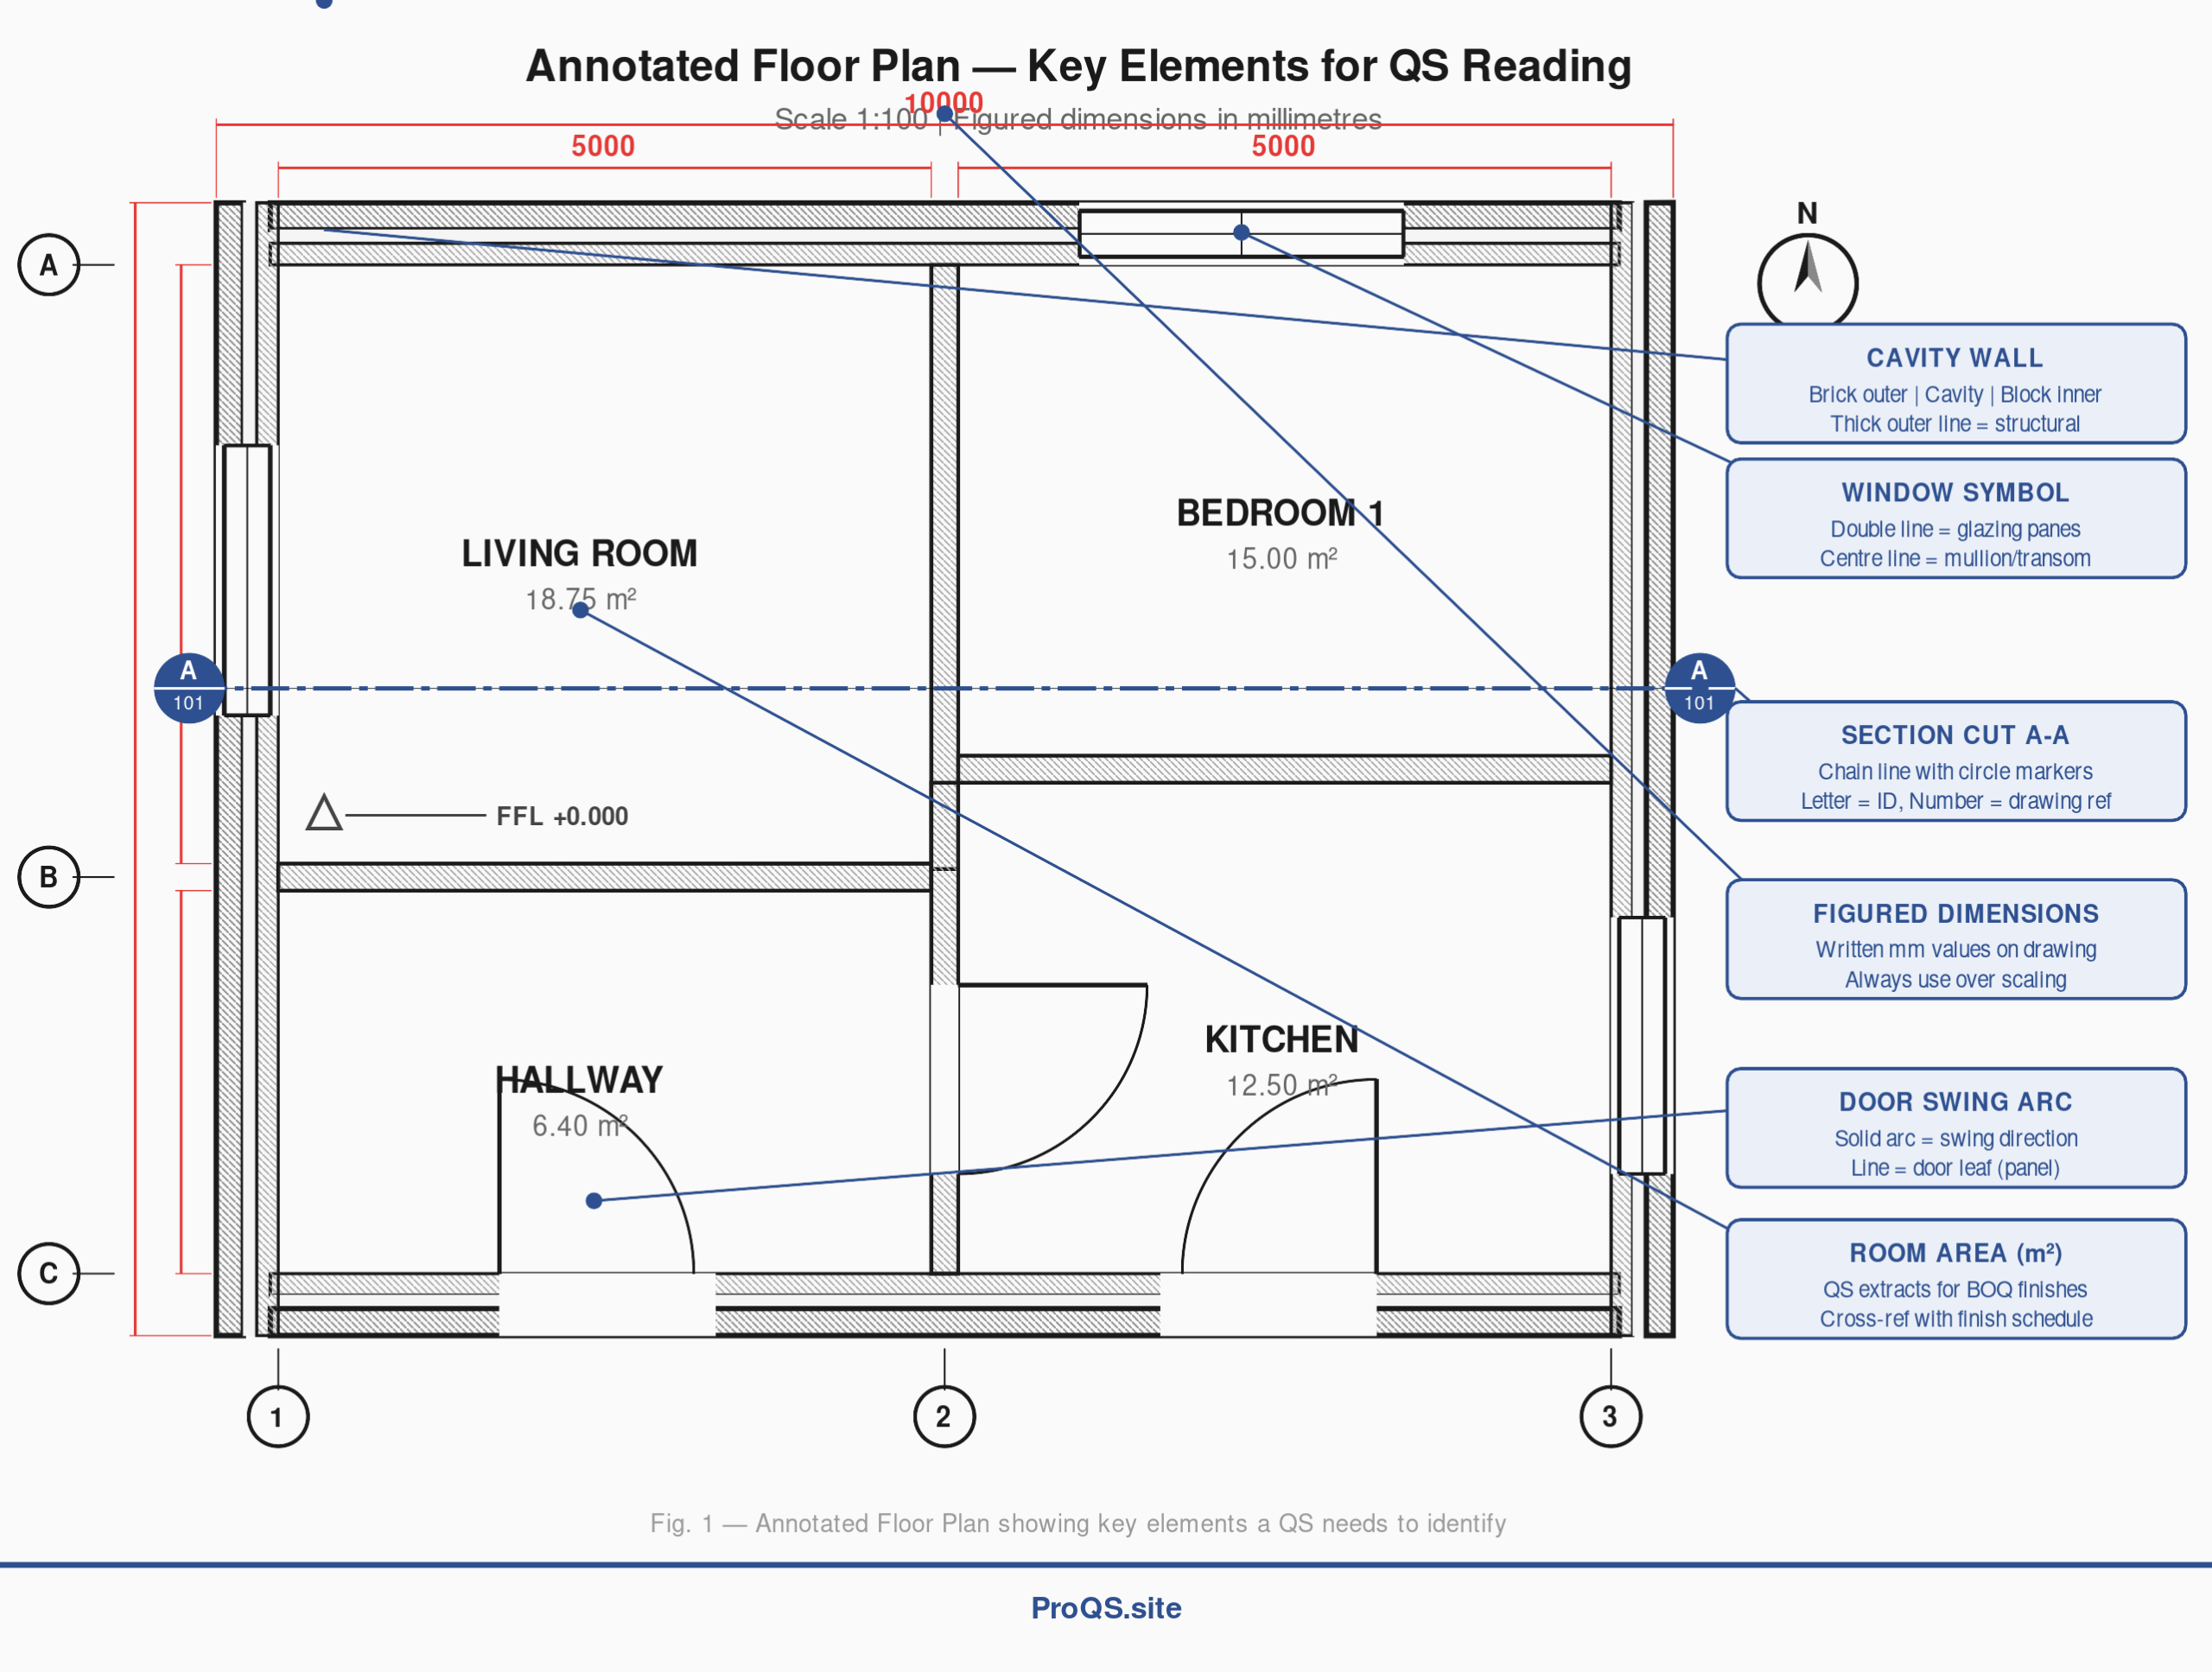
The annotated floor plan below illustrates the key elements a QS needs to identify when reading any plan drawing. Take note of the structural grid references, figured dimensions, section cut line, and the standard symbols for doors and windows.
[See Figure 1: Annotated Floor Plan — Key Elements for QS Reading]
When reading a floor plan, the QS should work systematically. Start with the structural grid (the lettered and numbered reference lines around the perimeter) to orient yourself. Check the figured dimensions — these are the written measurements in millimetres that appear between dimension lines. Always use figured dimensions in preference to scaling off the drawing. Identify all room areas, which may be annotated directly or which you will need to calculate from dimensions. Note door positions (shown as a leaf with a swing arc indicating opening direction) and window positions (shown as a double line representing the glazing). The section cut line (typically shown as a chain line with circular markers at each end labelled A-A, B-B, etc.) tells you where the corresponding section drawing is cut through the building.
The Building Section — Reading Vertical Relationships
Sections are arguably the most information-dense drawings for a QS. They reveal the third dimension that plans cannot show — the vertical build-up of the building from foundations to ridge.
[See Figure 2: Annotated Building Section — Vertical Relationships]
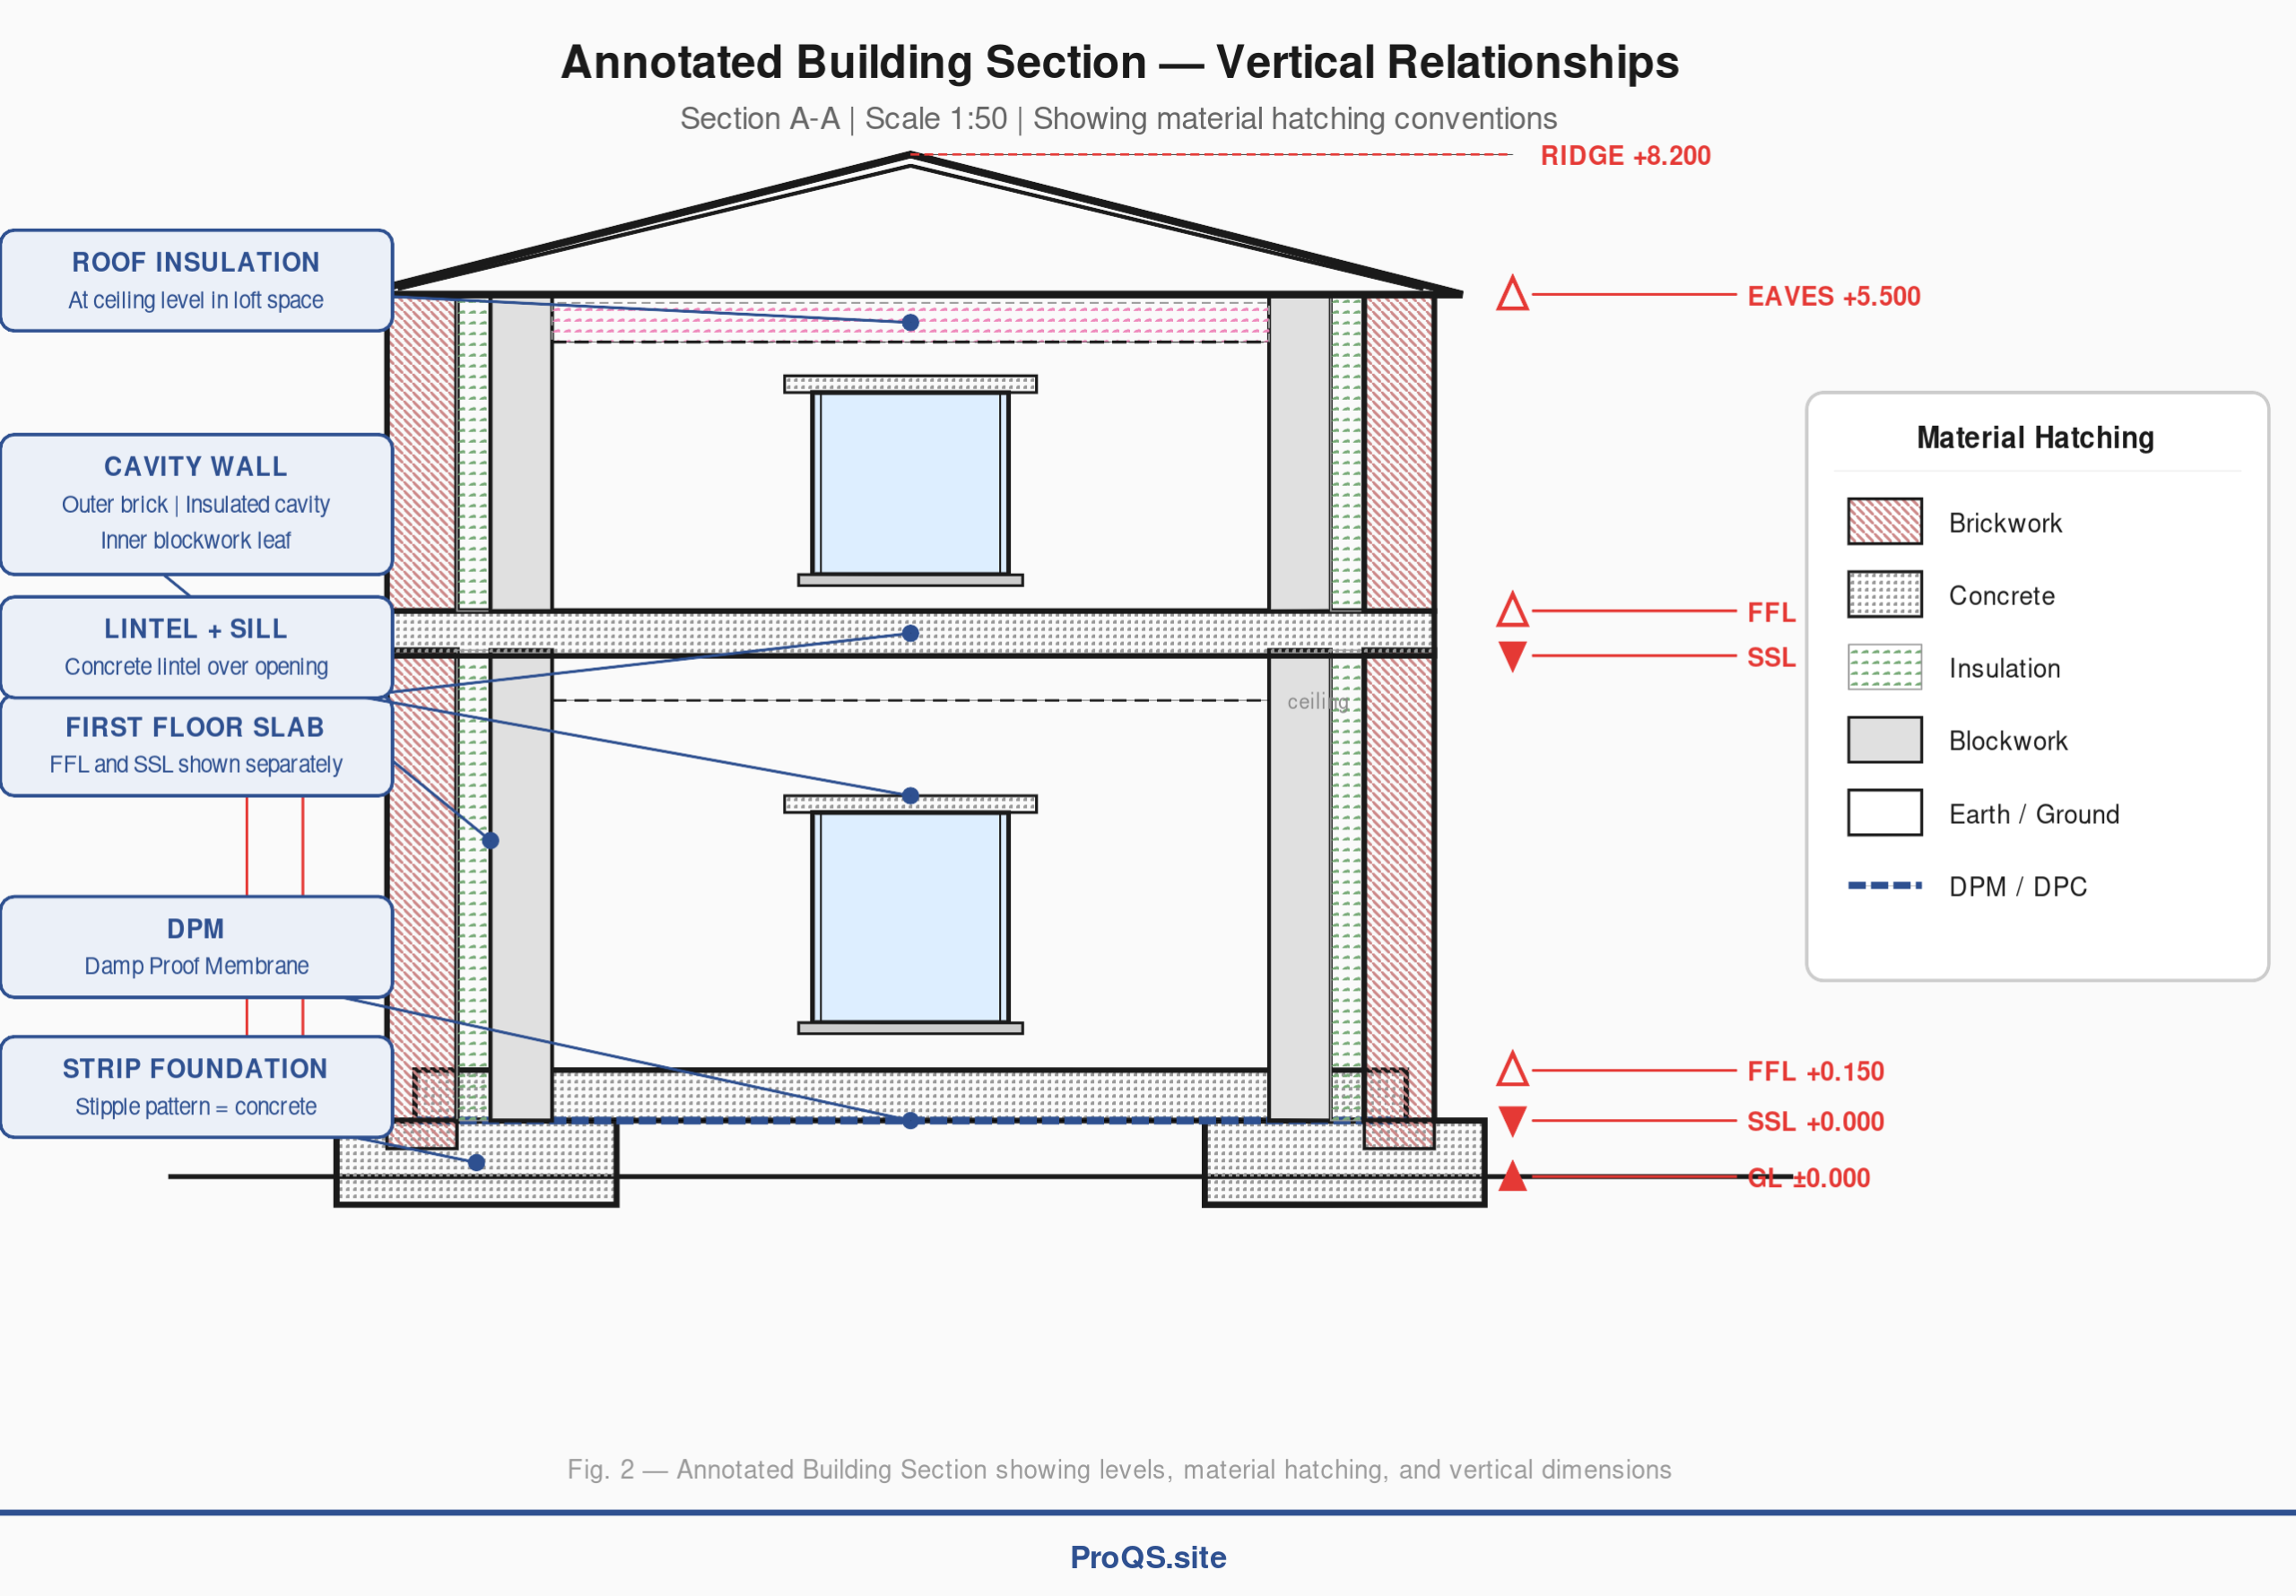
The section drawing above shows a typical two-storey domestic building cut vertically through the centre. Several critical elements are visible. The material hatching — different patterns used to indicate materials in section — tells you what each element is made of. Cross-hatching indicates brickwork, a stipple pattern indicates concrete, circular patterns indicate insulation, and dots indicate earth or fill. A full hatching key is provided in Figure 2.
The level markers on the right side show the key vertical reference points. GL (Ground Level) is the site datum. FFL (Finished Floor Level) is the top of the completed floor including all finishes. SSL (Structural Slab Level) is the top of the structural slab before finishes are applied — the difference between FFL and SSL tells you the depth of the floor finish build-up. The QS uses these levels to calculate floor-to-floor heights, ceiling heights, and the vertical extent of finishes, cladding, and internal wall elements.
Note the DPM (Damp Proof Membrane) shown as a dashed blue line at ground floor level — a specification item that must be measured and priced.
The Title Block — Your First Port of Call
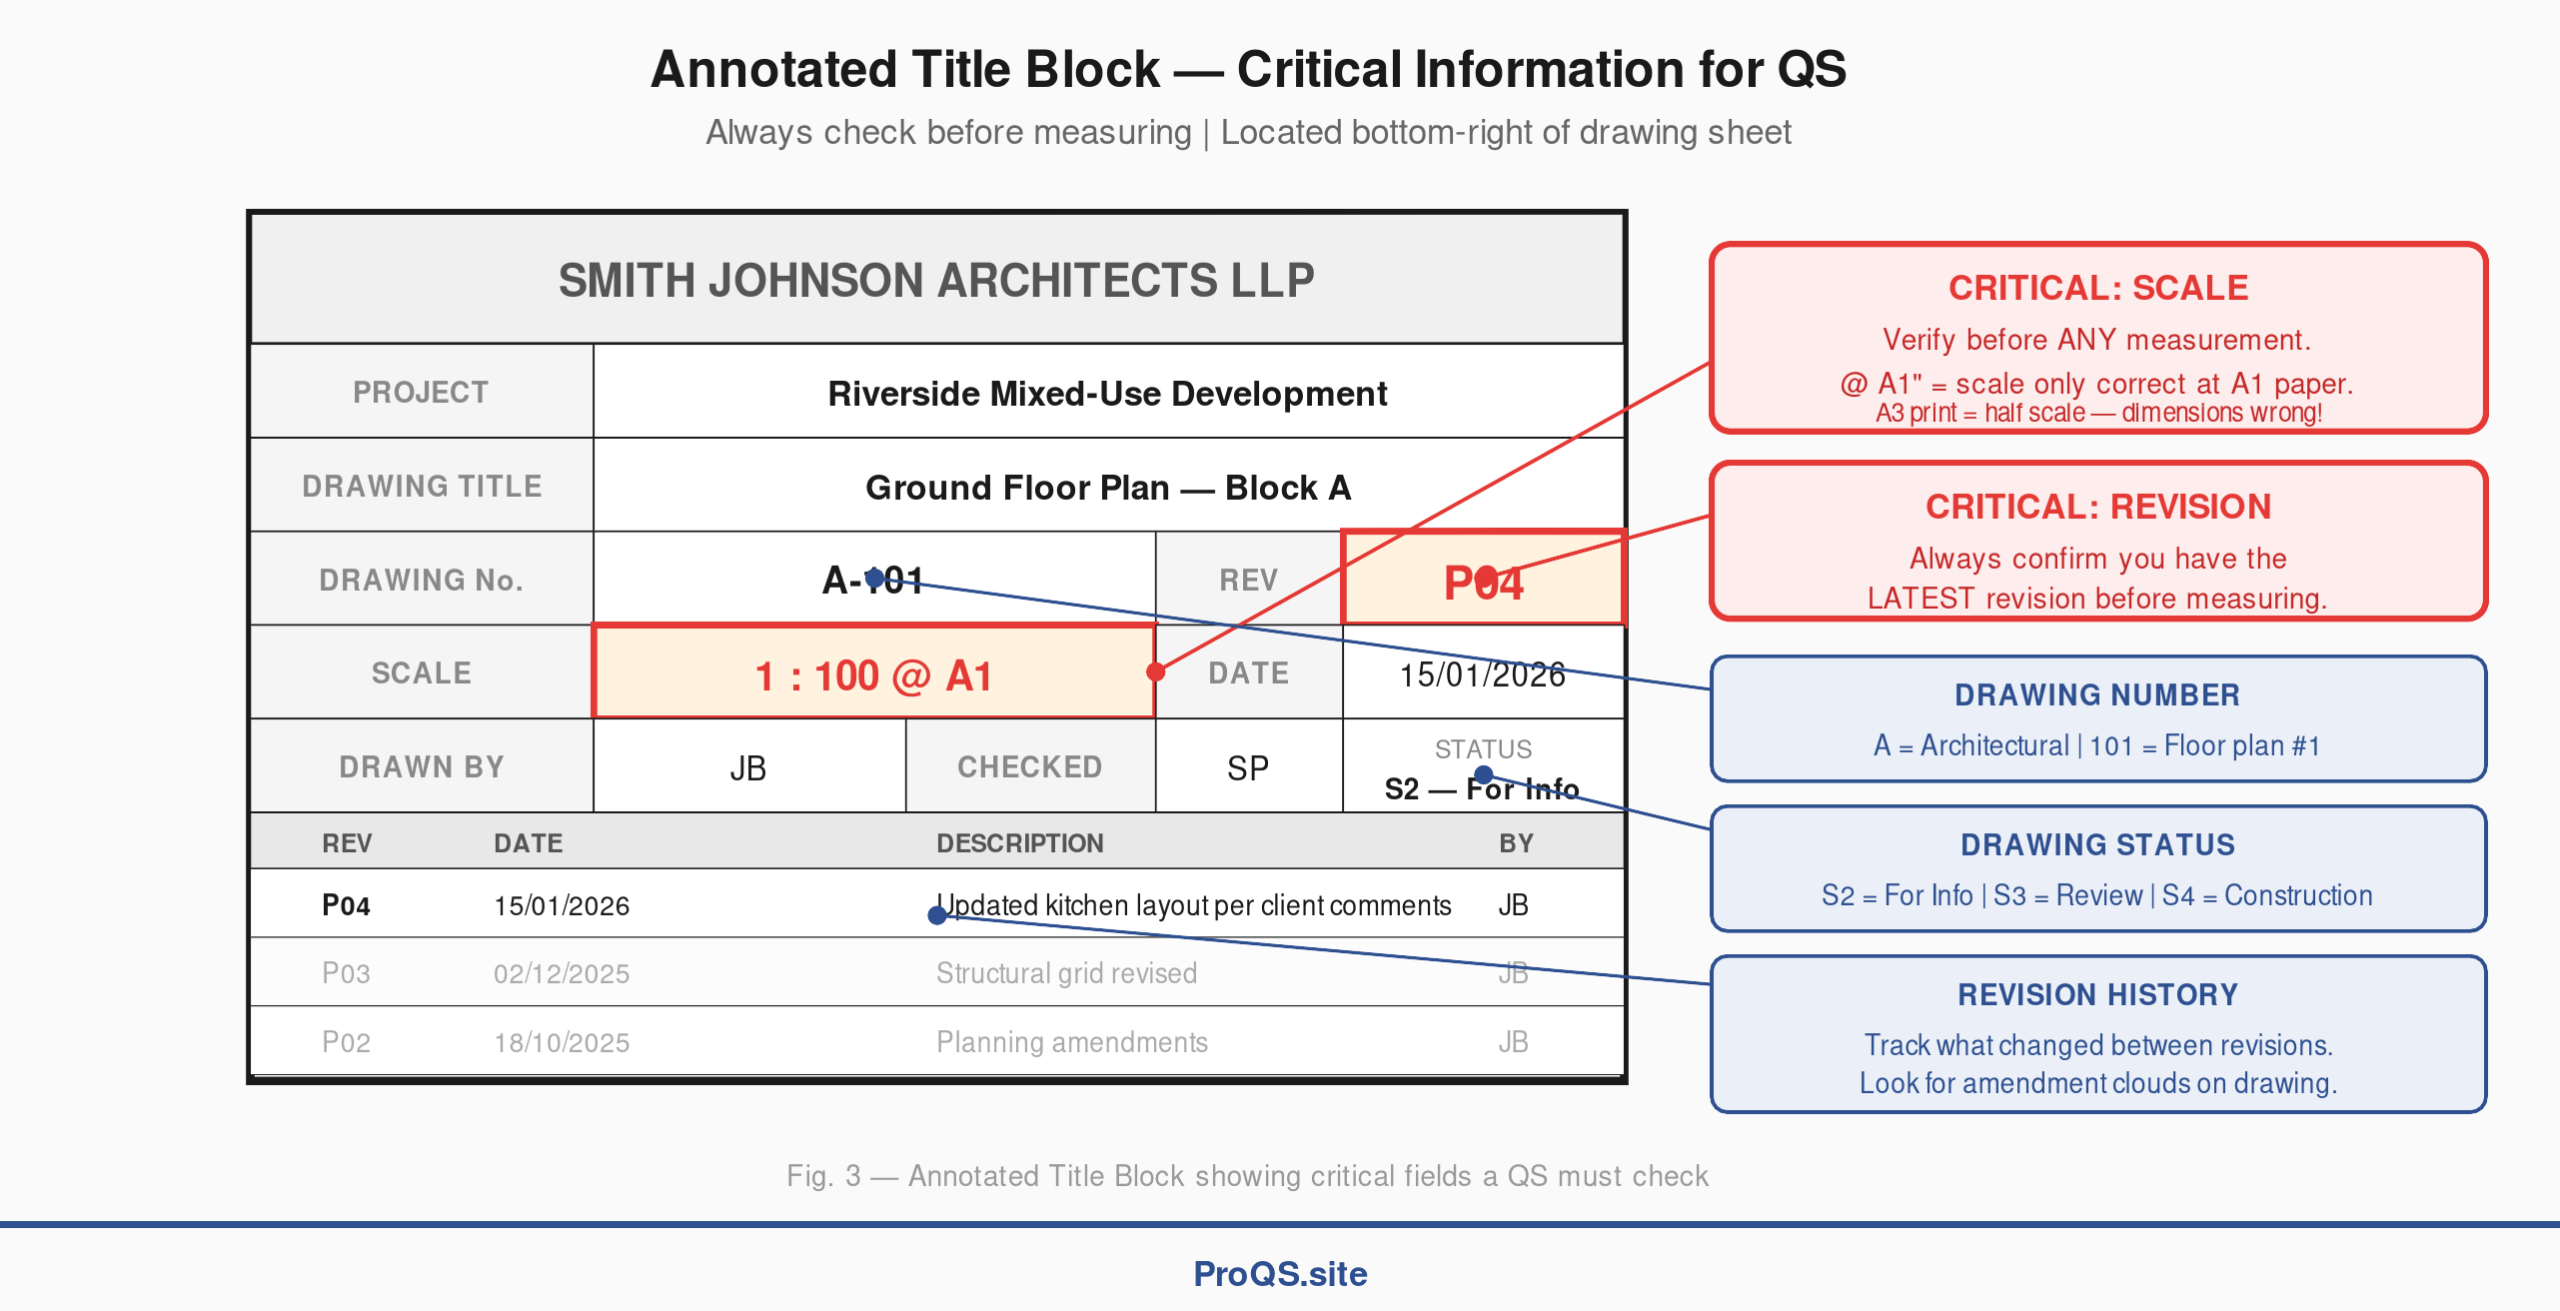
Before measuring anything, always check the title block. This small panel, typically located at the bottom-right corner of the drawing sheet, contains critical information that determines whether you are working from the correct, current version of the drawing.
[See Figure 3: Annotated Title Block — Critical Information for QS]
Two fields are absolutely critical, highlighted in red in the illustration above:
Scale. The title block states the drawing scale (e.g., 1:100 @ A1). The “@ A1” notation means the stated scale is only accurate when printed at A1 paper size. If you are working from an A3 reduction, the scale will be wrong — the drawing will be exactly half the stated scale. This is one of the most common measurement errors in practice. Always verify the scale before using a scale rule, and always prefer figured dimensions over scaling.
Revision. Drawings are updated as the design develops. Each update receives a new revision letter or number (P01, P02, P03, etc., or A, B, C). The title block shows the current revision and — in the revision table below — a history of what changed at each revision. Using an outdated revision means your measurements are based on a superseded design. Always confirm you have the latest issue before starting any measurement work.
The drawing number follows a convention where the first letter indicates the discipline (A for Architectural, S for Structural, M for Mechanical, E for Electrical) and the number sequence indicates the drawing type (typically 100-series for plans, 200-series for elevations, 300-series for sections, 400+ for details). On BIM projects following BS EN ISO 19650, the numbering convention is more structured: Project–Originator–Volume–Level–Type–Role–Number.
The status code tells you the drawing’s purpose. S2 means “For Information” (not yet approved for construction), S3 means “For Review”, and S4 means the drawing is suitable for construction. Measuring from a preliminary drawing carries risk — the design may change significantly before it is finalised.
Drawing Symbols and Line Conventions
Architectural drawings communicate through a standardised visual language of symbols, line types, and abbreviations. Understanding these conventions is essential for accurate interpretation.
[See Figure 4: Common Architectural Symbols — Quick Reference]
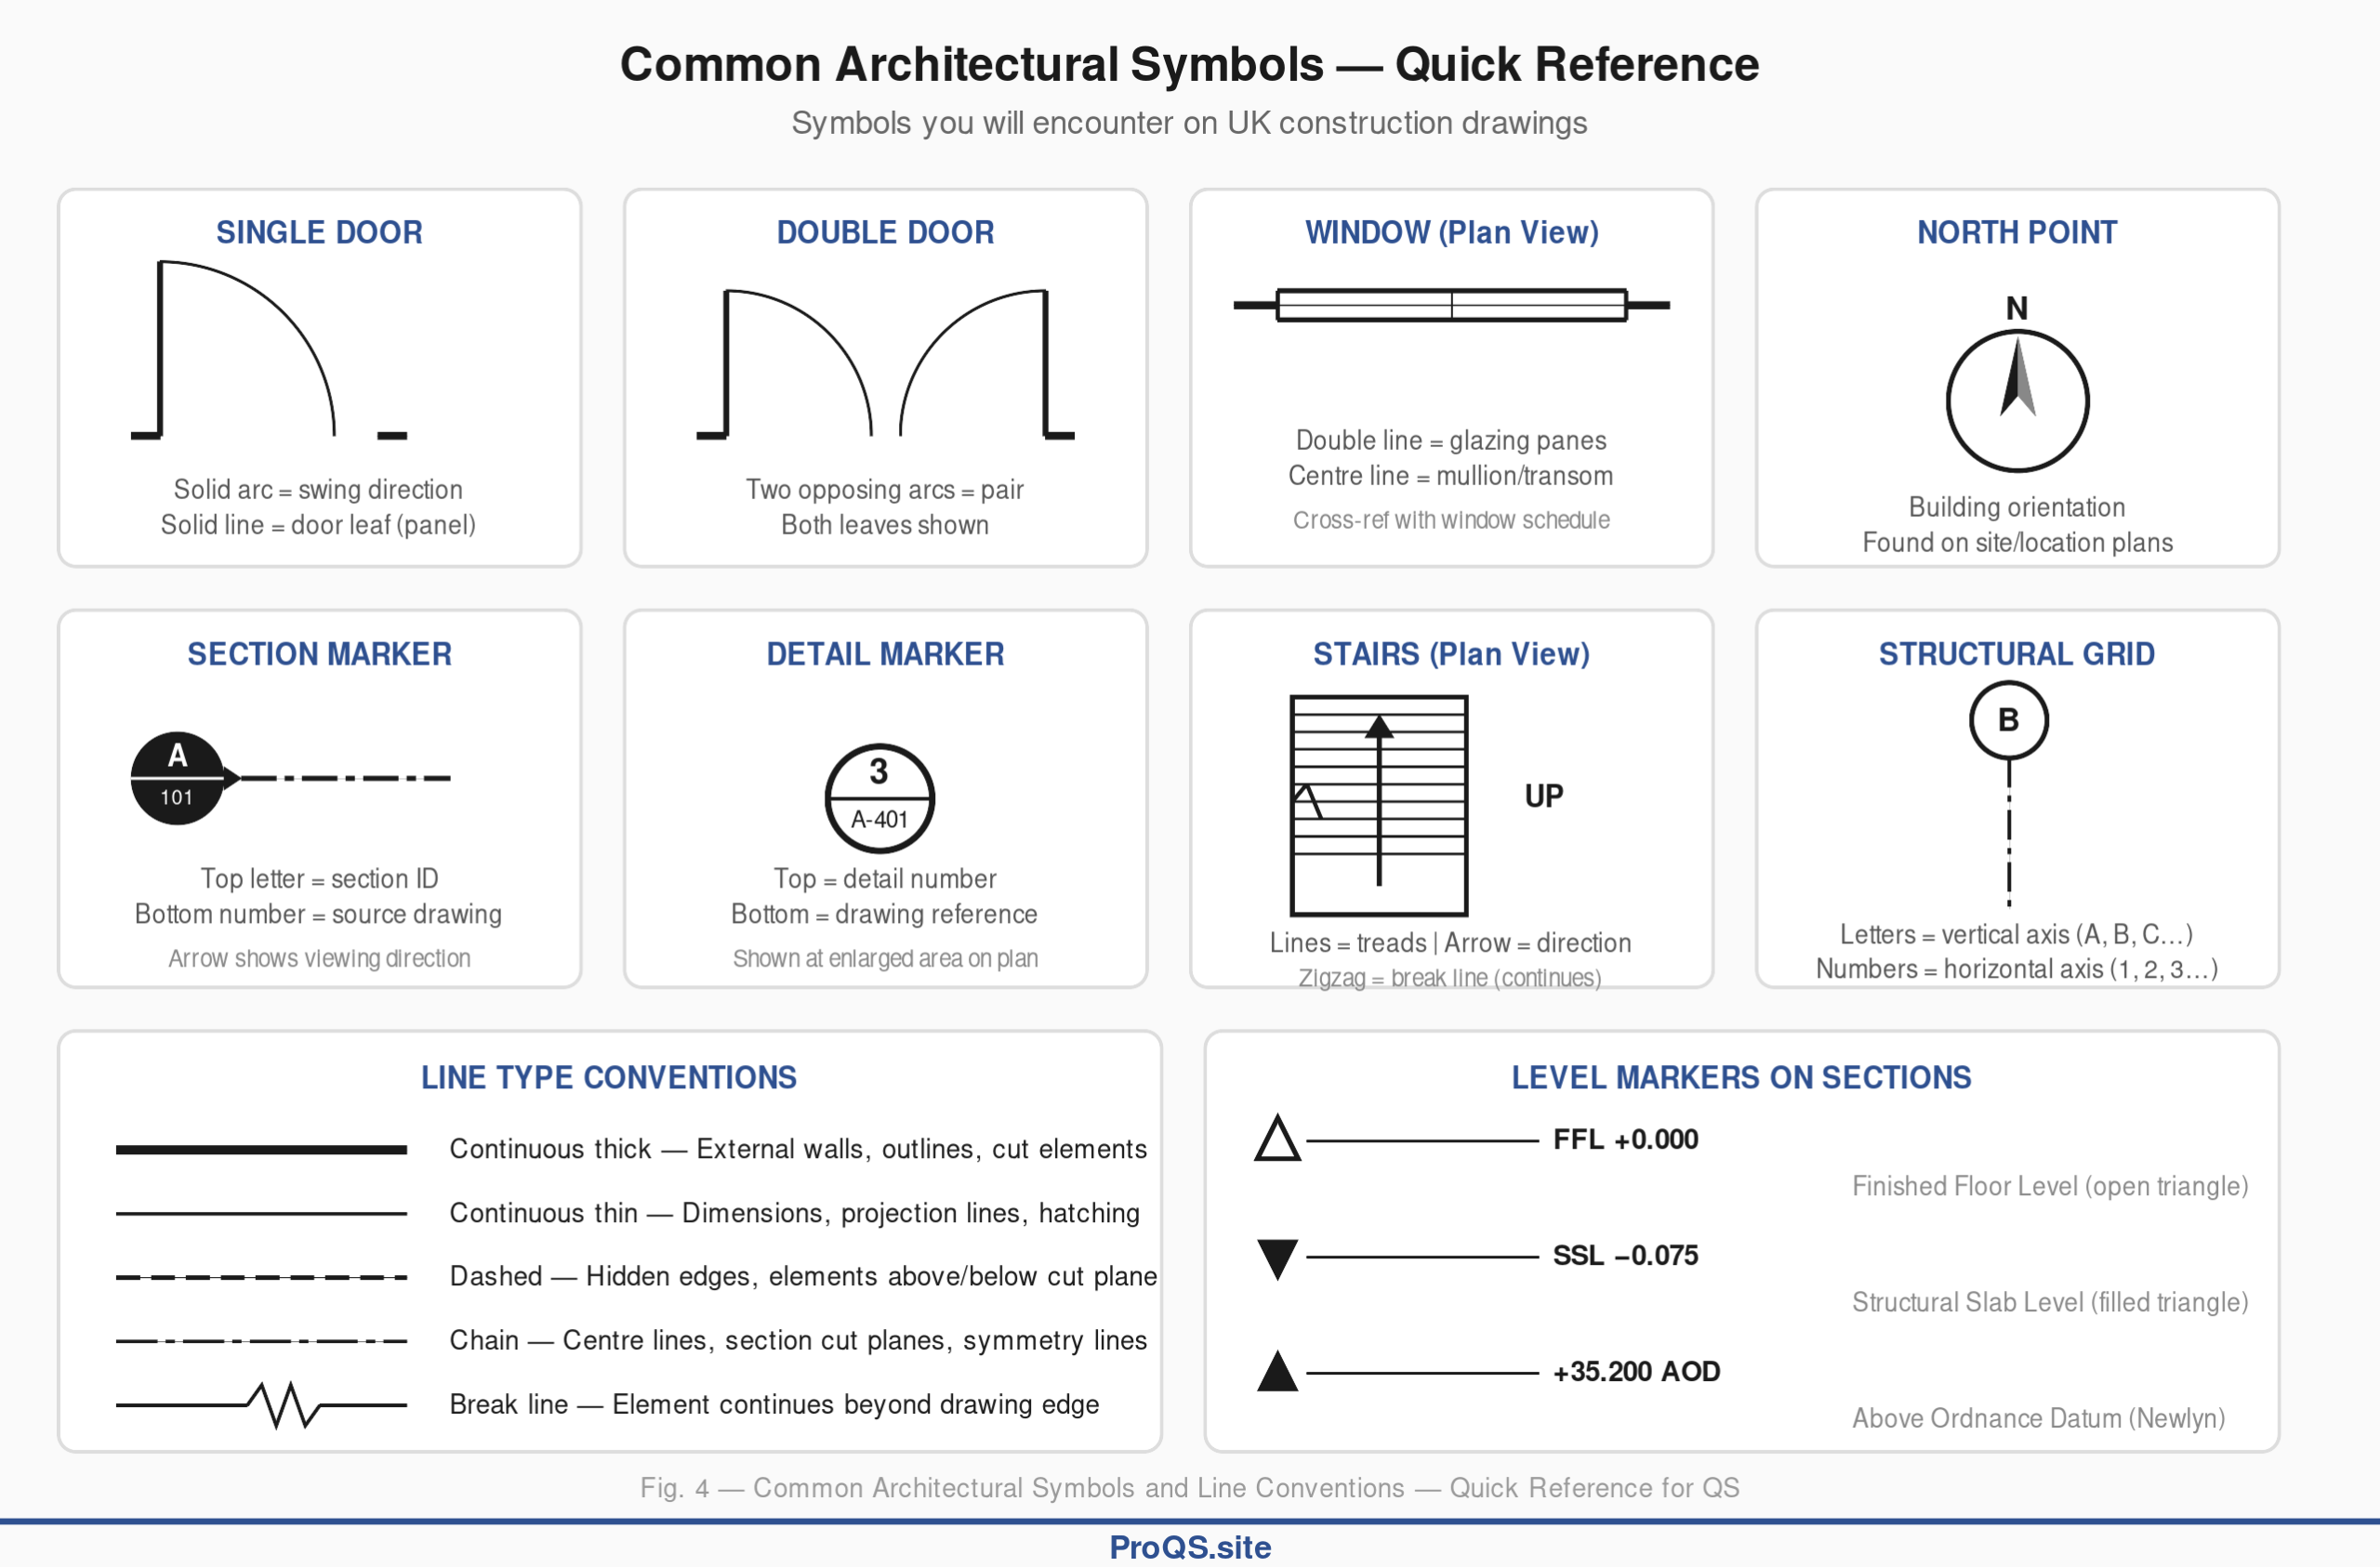
The key symbols you will encounter regularly are shown in the reference chart above. Door symbols show the leaf (a line representing the door panel) with an arc indicating the direction and extent of the swing. A single arc is a single door; two opposing arcs indicate a pair of doors. Window symbols in plan view appear as a double line within the wall thickness, representing the glazing. A centre line within the double line indicates a mullion or transom. Section markers are circles (usually filled or half-filled) containing a letter identifying the section and a number referencing the drawing sheet where the section is shown. Detail markers follow a similar convention — a circle with the detail number above a dividing line and the drawing reference below.
Line types carry specific meaning under BS 8888 and BS 1192. Continuous thick lines represent outlines and structural elements (external walls, columns). Continuous thin lines are used for dimensions, projection lines, and hatching. Dashed lines indicate hidden or concealed elements — for example, foundations shown below ground on a floor plan, or beams above the cut plane. Chain lines (alternating long and short dashes) denote centre lines, lines of symmetry, and section cut planes.
The Elevation — Extracting Façade Quantities
Elevations are the QS’s primary source for external envelope measurement. The annotated elevation below shows a typical two-storey building façade with the key elements a QS needs to identify and measure.
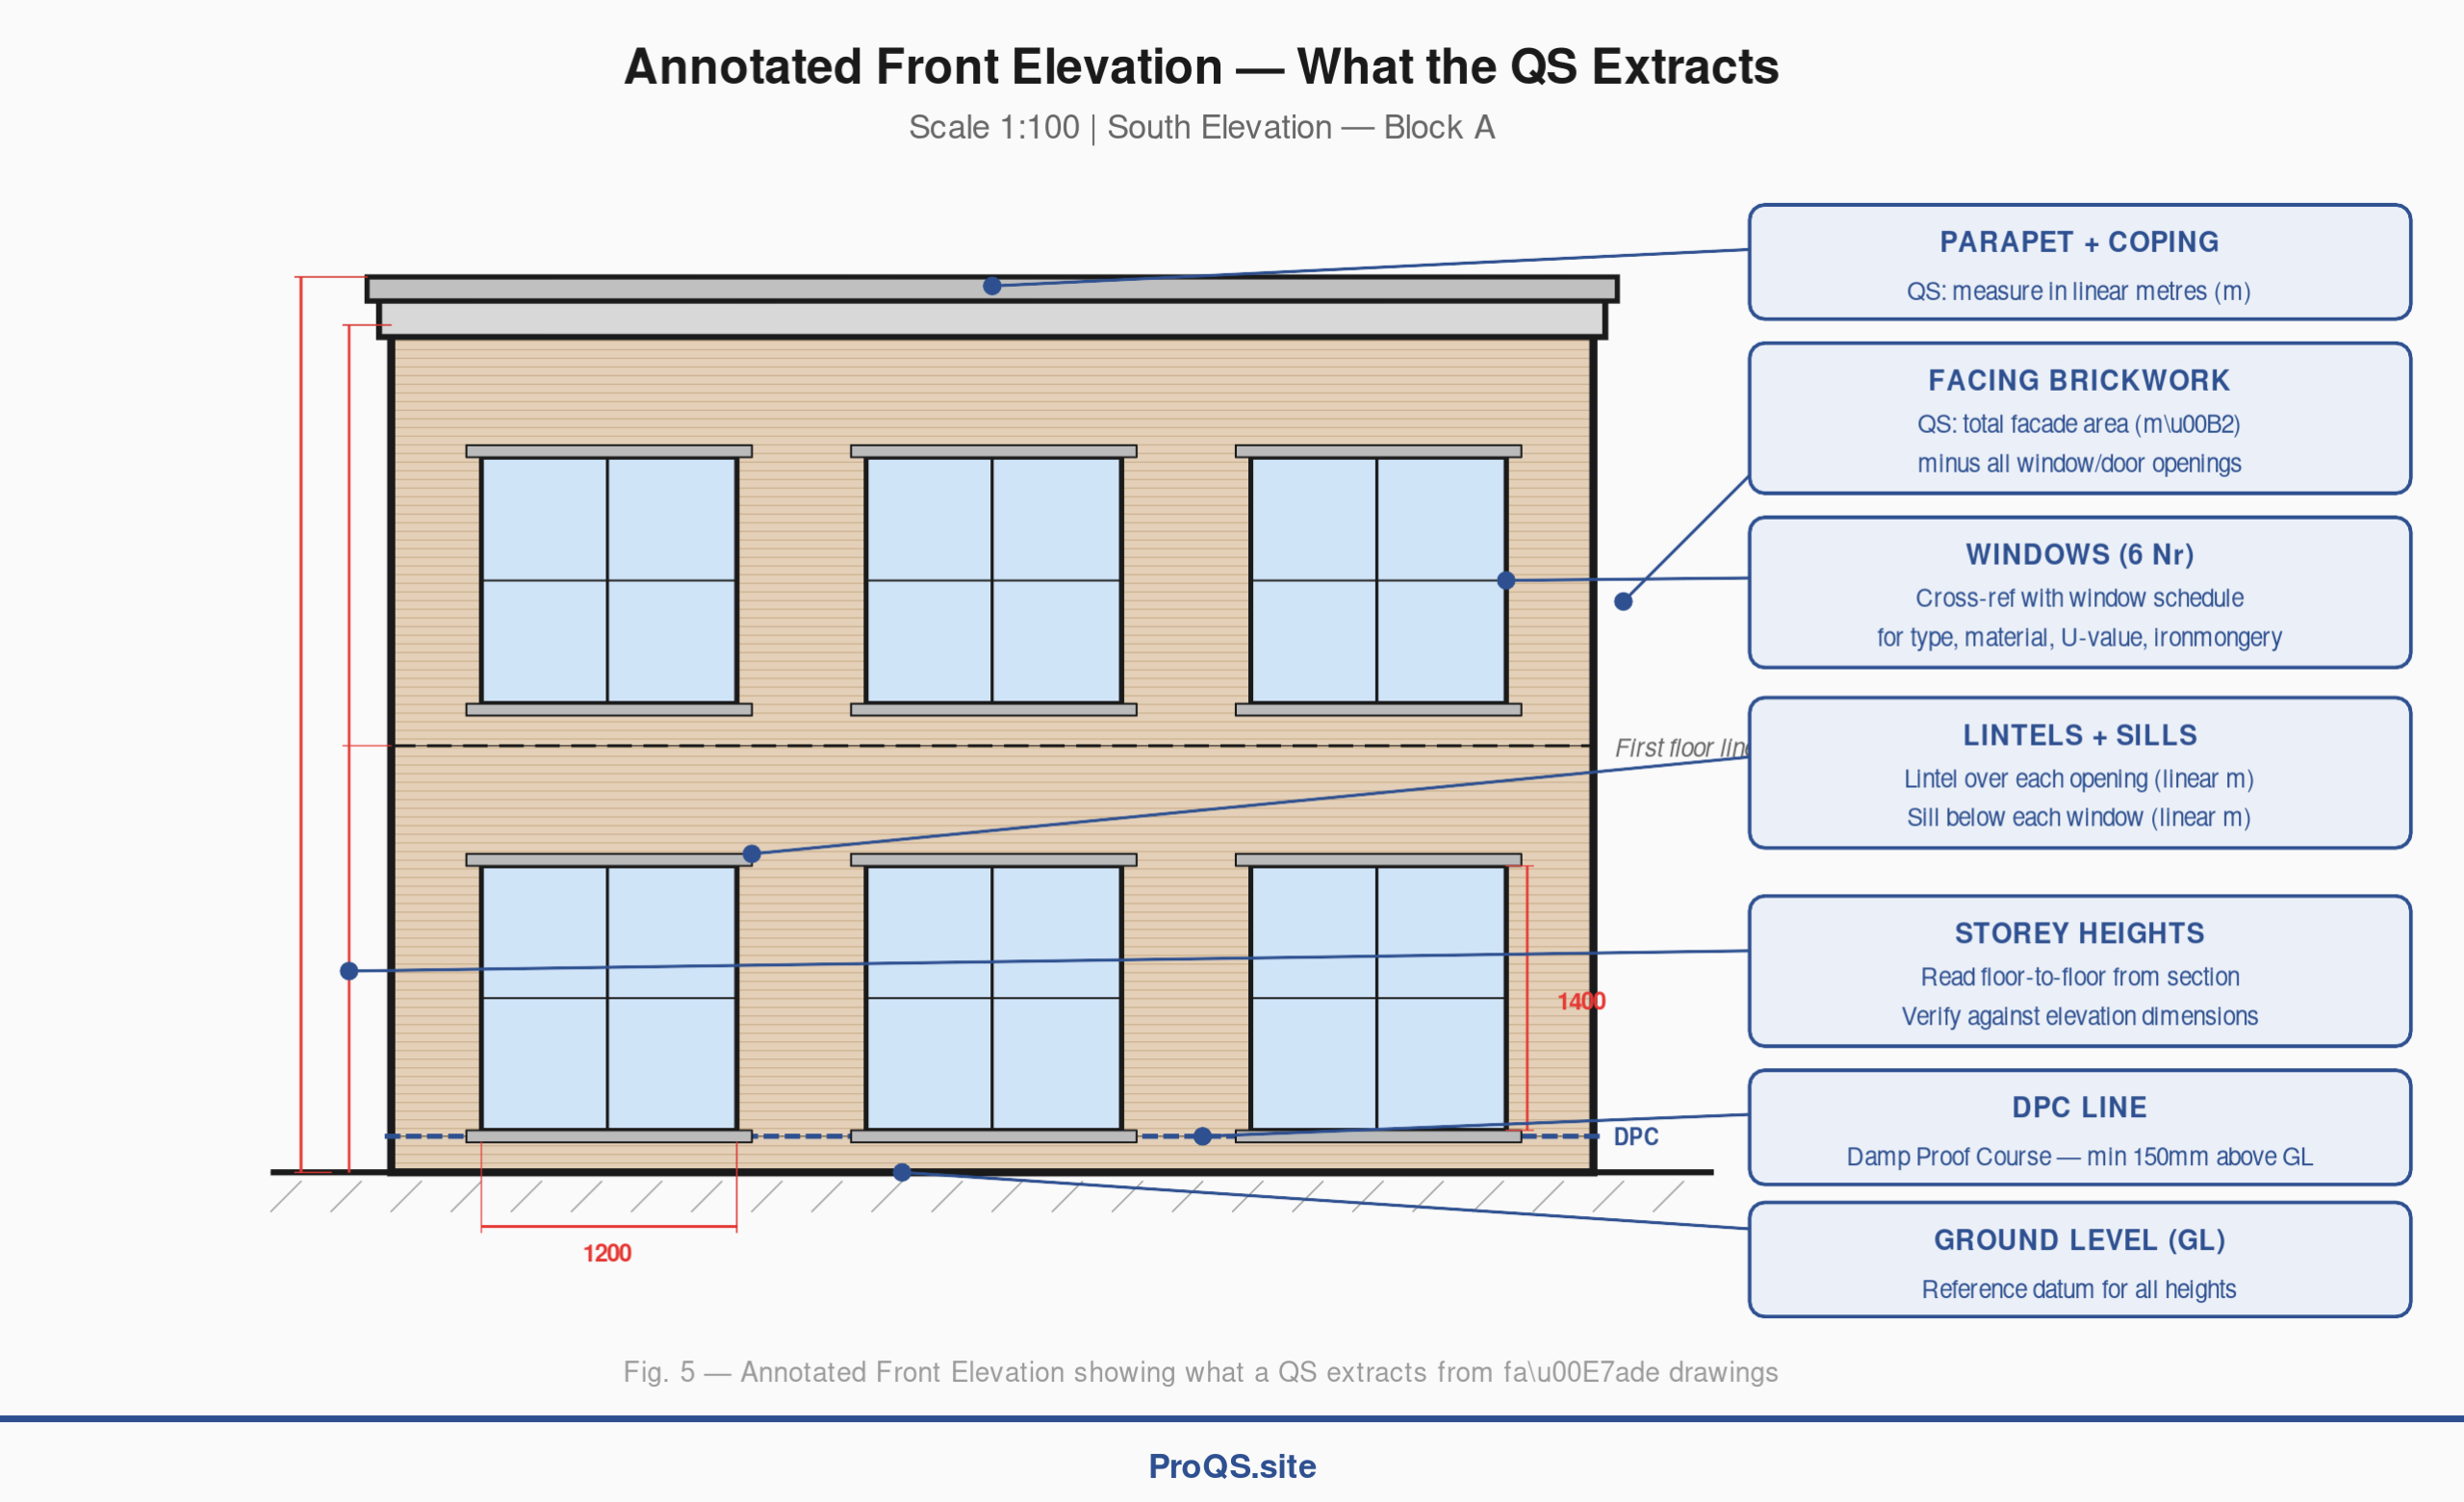
[See Figure 5: Annotated Front Elevation — What the QS Extracts]
The QS calculates the total façade area (building height × building width), then deducts the area of all openings (windows and doors) to arrive at the net cladding area. In the example above, the facing brickwork area would be the overall façade area minus the area of six windows and one entrance door. Each window must be cross-referenced with the window schedule to confirm the type (casement, sash, tilt-and-turn), material (timber, aluminium, uPVC), glazing specification (double/triple, U-value), and ironmongery. The entrance door is similarly cross-referenced with the door schedule.
Additional items measured from elevations include parapets and copings (measured in linear metres), sills and lintels (also linear), any projecting elements such as canopies or balconies, and rainwater goods (gutters and downpipes).
Dimensions and Levels
UK architectural drawings use millimetres as the standard unit for all dimensions on building drawings, with metres used for site-level dimensions on larger plans. Dimensions are shown between dimension lines — thin lines with arrowheads or tick marks at each end — with the measurement value written above or alongside.
There are two main dimensioning methods. Chain dimensioning (also called running dimensions) shows dimensions placed end-to-end in sequence along a run. This is common on floor plans for sequential room widths. The risk is that tolerances accumulate — if one dimension is slightly out, all subsequent dimensions are affected. Ordinate dimensioning measures every point from a single fixed datum, eliminating cumulative error. This is the preferred method for QS takeoff where available.
The golden rule for QS practice is: always use figured dimensions rather than scaling off the drawing. Scaling introduces inaccuracy from paper shrinkage (drawings printed on paper can shrink by 1-2%), printer distortion, or the drawing not being printed at the stated scale. Figured dimensions are the architect’s stated intent and take precedence.
Scale Conventions
Understanding scale is fundamental to reading any drawing. The table below shows the standard metric scales used in UK construction practice, with their typical applications.
| Scale | Application | 1 cm on Drawing = |
|---|---|---|
| 1:1 | Full-size details (rare) | 1 cm |
| 1:5 | Large component details | 5 cm |
| 1:10 | Construction details, joinery | 10 cm |
| 1:20 | Room details, wall sections | 20 cm |
| 1:50 | Detailed floor plans, large sections | 50 cm (0.5 m) |
| 1:100 | Standard floor plans, elevations | 1 m |
| 1:200 | Site plans, large building plans | 2 m |
| 1:500 | Site plans, masterplans | 5 m |
| 1:1250 | Ordnance Survey plans, location plans | 12.5 m |
| 1:2500 | Block plans, regional context | 25 m |
The most common scale in day-to-day QS practice is 1:100, used for standard floor plans and elevations. At this scale, 1 cm on the drawing represents 1 m in reality — making mental conversions straightforward. Detail drawings at 1:10 or 1:5 provide the construction-level information needed for pricing specialist items.
When using a triangular scale rule, each edge carries two scales (e.g., 1:100 and 1:200). Select the correct edge for the drawing scale, align it with the feature being measured, and read the dimension directly. Always cross-check your first measurement against a figured dimension on the drawing to confirm you are using the correct scale.
Common Abbreviations
UK construction drawings are dense with abbreviations. The table below covers the most frequently encountered abbreviations, with their meaning and QS relevance.
| Abbreviation | Meaning | QS Relevance |
|---|---|---|
| FFL | Finished Floor Level | Reference level for all internal measurements |
| SSL | Structural Slab Level | Structural depth calculations; FFL minus SSL = finish build-up |
| AOD | Above Ordnance Datum | Absolute height reference (Newlyn datum) |
| GL | Ground Level | Site datum for level changes and external works |
| CL | Centre Line | Structural grid positioning |
| DPC | Damp Proof Course | Material specification — horizontal barrier in masonry |
| DPM | Damp Proof Membrane | Material specification — sub-floor moisture barrier |
| NTS | Not To Scale | Warning: do not scale this drawing or element |
| Ø | Diameter | Circular openings, pipe sizes |
| Nr | Number (quantity) | Count of items |
| m² | Square metres | Area measurement unit |
| m³ | Cubic metres | Volume measurement unit |
A word of caution: some abbreviations are project-specific. Always check whether a project abbreviations list has been included in the specification documents. Confusing similar abbreviations — FFL and SSL, DPC and DPM — is a common source of error for junior staff.
Reading Drawings for Quantity Surveying — The Workflow
Extracting quantities from drawings is not simply a matter of picking up a scale rule and measuring. It is a structured process that requires discipline, cross-referencing, and attention to detail. The following five-step workflow reflects best practice in UK QS offices.
Step 1 — Preparation. Obtain the complete drawing set and verify you have the latest revision of every sheet. Check the drawing register (a list of all drawings issued) against what you actually hold. Obtain the written specifications — drawings and specifications are complementary documents, and measuring from drawings alone will miss critical information about materials, standards, and performance requirements.
Step 2 — Familiarisation. Read all drawings in a logical sequence: site plan first (to understand the overall scheme), then floor plans (room by room), then sections (to understand the vertical build-up), then elevations (external envelope), then detail drawings (construction specifics). This top-down approach builds a mental model of the building before you start measuring.
Step 3 — Measurement. Measure quantities using NRM 2 (RICS New Rules of Measurement, Volume 2) as the standard measurement framework. Use figured dimensions wherever available. Where dimensions are missing, use a calibrated scale rule as a last resort and note that the measurement is scaled, not figured. Mark up the drawing as you go — highlight or annotate each element as it is measured so nothing is missed or double-counted.
Step 4 — Cross-referencing. Verify every measurement against at least one other source. Check plan dimensions against section dimensions. Confirm material types against the specification. Verify window and door quantities against the schedules. Identify and record any discrepancies or ambiguities — these must be raised with the design team before finalising the bill.
Step 5 — Documentation. Record the source drawing number and revision for every measurement. Note any assumptions made. Flag any items where information is incomplete or conflicting. This audit trail is essential — your measurements may be questioned months or years later, and you need to be able to demonstrate the basis for every figure.
Common Mistakes When Reading Drawings
Even experienced QS professionals can fall into traps when reading architectural drawings. The following are the most frequent errors encountered in practice, particularly among students and junior staff.
| Mistake | Impact | Prevention |
|---|---|---|
| Using the wrong scale | Measurements off by a factor of 2× or more | Always verify scale on title block before measuring; check paper size matches stated scale |
| Scaling instead of using figured dimensions | Inaccurate quantities due to paper shrinkage or print distortion | Always use written dimensions first; scale only as a last resort |
| Using an outdated revision | BOQ based on superseded design; re-measurement required | Check title block revision; verify against drawing register; look for amendment clouds |
| Not reading the specification | Material types, standards, or finishes incorrect in BOQ | Always read specifications alongside drawings; they are complementary documents |
| Missing sheets from the drawing set | Incomplete quantities; whole elements omitted from BOQ | Check drawing index; verify all sheets received; request missing items immediately |
| Not cross-referencing between drawings | Conflicts or inconsistencies carried into BOQ unchallenged | Cross-check plans against sections, elevations against schedules |
| Ignoring NTS (Not To Scale) notation | Attempting to scale a drawing that is explicitly not to scale | Respect NTS notation; obtain figured dimensions from architect |
| Confusing abbreviations | Wrong level reference or specification applied | Maintain a personal abbreviations reference; verify against specification |
The single most important habit to develop is checking the title block before you do anything else. Revision, scale, and status — these three pieces of information determine whether the drawing is worth measuring from at all.
Digital Tools and BIM
While traditional paper-based drawing reading remains a core skill, the industry is increasingly digital. Understanding the tools and formats you will encounter is essential for modern QS practice.
PDF markup and on-screen takeoff. Most drawings are now distributed as PDFs, and the QS performs measurement on screen rather than on paper. Bluebeam Revu is the industry-standard tool for UK quantity surveying. It allows you to calibrate the PDF to the drawing’s stated scale, then use digital measurement tools (linear, area, perimeter, volume) to take off quantities directly on screen. Measurements can be colour-coded by element type, totalled automatically, and exported to Excel. The Quantity Link feature provides a live connection between PDF markups and an Excel cost spreadsheet — when the drawing changes, measurements can be updated and costs recalculated in real time.
CAD files. If you receive the original CAD files (typically DWG format from AutoCAD), you can extract quantities more precisely because the geometry is defined by exact coordinates rather than by scaling a printed image. Understanding CAD layer naming conventions (which follow BS 1192 or ISO 19650 structures) helps you isolate specific element types — for example, filtering to show only external walls or only window openings.
BIM (Building Information Modelling). On projects delivered under BS EN ISO 19650, the design exists as a three-dimensional information model rather than a set of 2D drawings. In principle, the QS can extract quantities directly from the model — wall areas, floor areas, structural element sizes, and material specifications are all embedded in the model data. In practice, model quality varies significantly, and the QS must verify that the model is sufficiently detailed and correctly specified before relying on automated quantity extraction. BIM does not eliminate the need to understand drawing conventions — 2D drawings are still extracted from the model, and the QS must be able to read them.
Practical Tips for Students and Junior QS Staff
Reading drawings is a skill that improves with practice. The following practical tips will accelerate your development.
Build a personal reference sheet. Create your own quick-reference card of common symbols, abbreviations, and hatching patterns. Keep it on your desk until the conventions become second nature. The symbol chart in this article is a starting point — add to it as you encounter project-specific conventions.
Always start with the title block. Before you even look at the drawing content, check the scale, revision, and status. This takes ten seconds and prevents hours of wasted work on the wrong version.
Read drawings in context, not isolation. A floor plan on its own tells you the horizontal layout. Combined with a section, you understand the vertical build-up. Combined with the specification, you know what materials are used. Combined with the schedules, you know the exact types and sizes of windows, doors, and finishes. No single drawing tells the whole story.
Mark up as you measure. Use a highlighter (physical or digital) to mark every element as you measure it. This prevents double-counting and ensures nothing is missed. Use different colours for different element types if the drawing is complex.
Ask questions early. If something on a drawing is unclear, ambiguous, or apparently contradicts another drawing, raise it immediately with the design team. Do not assume or guess. Ambiguities left unresolved during measurement will become costly disputes during construction.
Practice regularly. Obtain sample drawings from textbooks, online resources, or (with permission) real projects. Practice identifying the key elements described in this article. The more drawings you read, the faster and more accurate your interpretation becomes.
Further Reading
For more on the QS skills that build on drawing interpretation, see the following ProQS articles:
Introduction to Estimating in Construction — how measured quantities from drawings feed into the estimating process.
Feasibility and Quantity Surveying — how early-stage drawings inform feasibility cost estimates.
Risk Management: Tools and Techniques — how drawing ambiguities and incomplete information feed into project risk assessment.
Construction Law for the Quantity Surveyor — how drawing revisions and specifications interact with contractual payment mechanisms.
Value Engineering and Quantity Surveying — how design changes shown on revised drawings affect project value.
Key References
RICS NRM 2: Detailed Measurement for Building Works — the standard measurement framework for UK quantity surveying, defining how quantities are measured from drawings.
BS EN ISO 19650 — the UK-adopted international standard for organising and digitising information about buildings, replacing BS 1192 for BIM workflows.
BS 8888 — technical product documentation and specification, covering drawing conventions, symbols, line types, and dimensioning rules.
Designing Buildings Wiki — Types of Drawing — a comprehensive reference covering all drawing types used in UK building design.
Bluebeam Revu — Takeoff and Estimation — the industry-standard digital takeoff tool used by UK quantity surveyors for on-screen measurement.